- 5 September, 2017
- Economy and Energy

Recently the RA National Statistical Service published a number of statistical data describing the level of investment activity in Armenia during the first quarter of 2017. It is no secret that in order to reach its target objectives, the current RA Government attaches special importance to activating the RA investment environment and intensively attracting foreign capital. Attraction of large-scale investments into the RA economy was also one of the key election promises of the Government. Thus, it would be interesting to examine the volume and structure of foreign investment flows to Armenia during the aforementioned period.
Net Flow Dynamics of Foreign Investments
According to the published data, during the first quarter of the current year, the volume of total net investment flows in the real sector of RA economy made up -24.8 billion AMD, which is less than the that of 2016 by 65%, and is almost 130% less than the figure in the comparable period of 2015. This means that during the first quarter of 2017, repayments in terms of foreign total investments have exceeded the receipts, which is a rather disturbing indicator for a country with capital inflow deficit such as Armenia.
Regarding the volume of net inflows of foreign direct investments, it made up 17.3 billion AMD during January-June of 2017, which is less than the figure in the comparable period of 2016 by 1.2 billion AMD or by around 7%, and it is less than the 2015 figure by around 13.4 billion AMD or 44%.
During January-June 2017, the large part of net inflows of foreign direct investments, namely, 31.6 billion AMD, was directed to the mining sector. In parallel, large investments were made in real estate operations (3.8 billion AMD) and base metal production sectors (3.7 billion AMD). In contrast, dramatic decline of investment flows in telecommunications (-17.9 billion AMD) and beverage production (-9.5 billion AMD) sectors have been observed during the first quarter of this year.
Geographical Structure of Foreign Investments
In parallel to changes in volume of net inflows of foreign investments, the geographical structure of investment inputs has also changed. Thus, during the first quarter of the current year, Jersey Island was the largest source of foreign investments. The capital inflow from the island made up 31.6 billion AMD. Jersey Island is one of the most famous offshore zones in the world, and it is noteworthy that these means were fully directed to one sector only, namely, a sector adjacent to mining industry. Moreover, in terms of net inflow volumes of investments, the two countries following Jersey Island are Luxemburg (2.4 billion AMD) and Cyprus (1.8 billion AMD). And these countries are also considered large offshore zones.
On the other hand, sharp decline has been observed in the net inflow volume of direct investments from the United Kingdom, reaching 1.7 billion AMD from the previous 14.3 billion AMD (88% decline). In parallel, the net inflow volume of direct investments from Lebanon has declined by 12.8 billion AMD, and investment inflows from France have declined by 6.1 billion AMD.
Regarding the mutual investments dynamics among the EAEU member countries, it should be noted that it continued to display negative tendencies during this year. As in the past, Armenia has not established investment relations with two EAEU member countries, namely, Kazakhstan and Kyrgyzstan, in spite of the fact that Armenia is in the same economic union zone with those countries. During this year, certain activity has been observed only in the relations with Belarus. The net inflow of total investments from that country has reached 118.7 million AMD, which has been completely redirected to the wholesale trade sector.
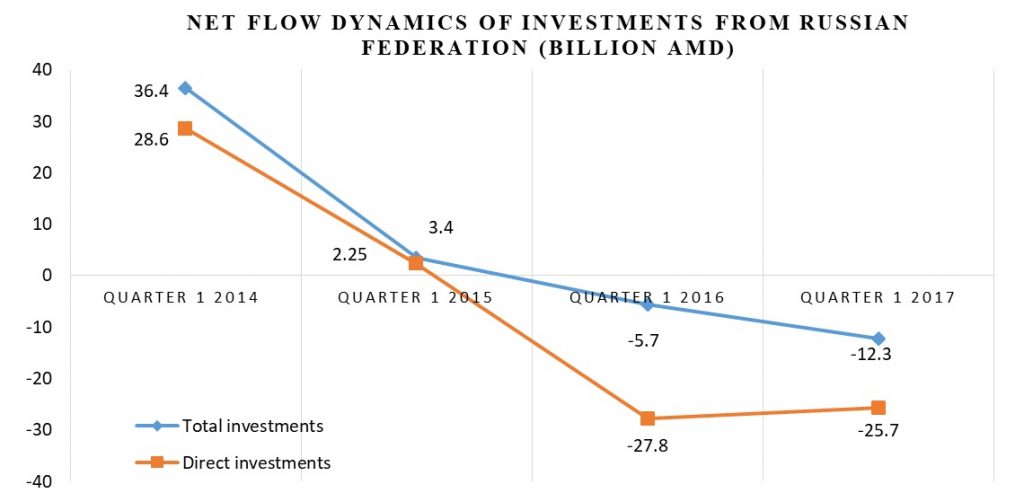
The net inflow volume of investments from the Russian Federation continued to drop during this year. Thus, before Armenia’s membership in the EAEU, the net inflow volume of foreign direct investments from Russia made up 36 billion AMD during the first quarter of 2014, forming 48.5% of total direct investments.
As can be seen from the figure, this indicator decreased by 10 times (reaching 3 billion AMD) in the first quarter of 2015, making up only 11.2% of total investments. The decline continued in 2016 when the net inflows of direct investments made up -5.7 billion AMD, which means that repayments (outflow) in terms of Russian investments exceeded receipts (inflow). During the current year, these tendencies have exacerbated, as a result of which the net inflow volume of direct investments has decreased by additional 6.6 billion AMD, ultimately reaching -12.3 billion AMD level.
Andranik Manukyan
“Union of Informed Citizens”


